Yatharth Hospital Share Price
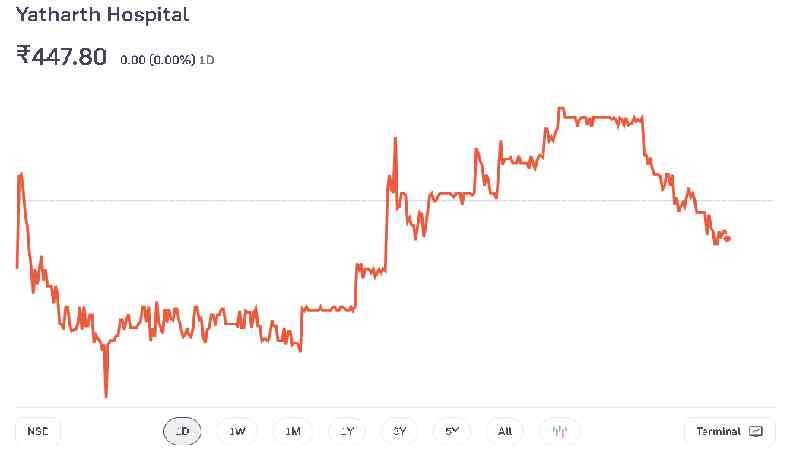
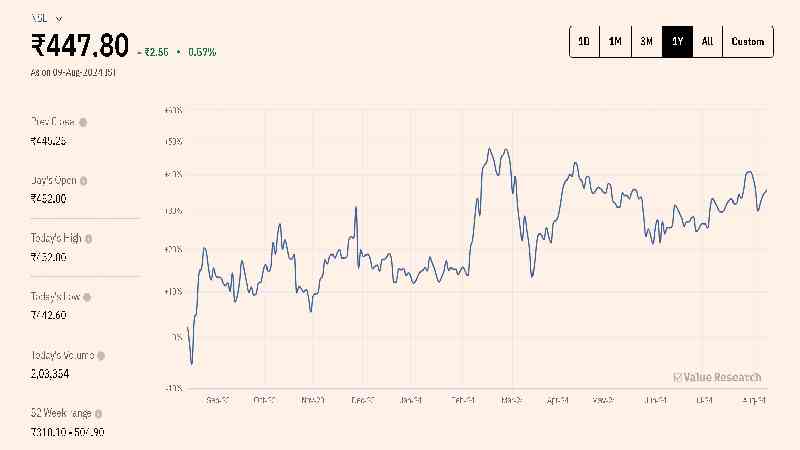
Yatharth Hospital and Trauma Care Services Ltd. is a healthcare company listed on India’s National Stock Exchange (NSE). The stock is currently trading at ₹448.55, showing a decline of ₹5.80 or 1.28% as of August 2, 2024, at 15:58.

Stock Performance Overview
| Open | 452.00 |
| Previous Close | 445.25 |
| Volume | 203,354 |
| Value (Lacs) | 910.62 |
| i VWAP | 447.69 |
| Beta | 0.80 |
| Mkt Cap (Rs. Cr.) | 3,844 |
| Open | 452.00 |
| Previous Close | 445.25 |
| Volume | 203,354 |
| Value (Lacs) | 910.62 |
| High | 452.00 |
| Low | 442.60 |
| UC Limit | 534.30 |
| LC Limit | 356.20 |
| 52 Week High | 504.90 |
| 52 Week Low | 310.10 |
| Face Value | 10 |
| All Time High | 504.90 |
| All Time Low | 306.10 |
| 20D Avg Volume | 224,317 |
| 20D Avg Delivery(%) | — |
| Book Value Per Share | 97.49 |
| Dividend Yield | — |
| All Time High | 504.90 |
Valuation Metrics
Yatharth Hospital’s market capitalization is ₹3,850 crore, with a face value of ₹10 per share. The stock’s price-to-book (P/B) ratio is 4.60, considered low compared to the sector average. The trailing twelve-month (TTM) price-to-earnings (P/E) ratio is 45.86, while the sector P/E stands at 84.18, indicating that the stock may be undervalued compared to its peers. The company’s book value per share is ₹97.49, which currently does not offer a dividend yield.

Technical Analysis
The stock’s technical indicators present a mixed picture. The short-term trend appears bullish, while the long-term trend shows some volatility. The stock is currently trading above its 5-day, 10-day, and 20-day simple moving averages (SMAs), which are ₹458.18, ₹451.98, and ₹443.11, respectively. It suggests short-term strength in the stock price.
Pivot Points and Support/Resistance Levels
Classical pivot point analysis shows the following levels:
- Resistance levels: R1 at ₹453.52, R2 at ₹458.48, R3 at ₹462.82
- Support levels: S1 at ₹444.22, S2 at ₹439.88, S3 at ₹434.92
Traders can use these levels for potential entry and exit points in short-term trading strategies.
Financials

Price Performance
Looking at the price performance over different time frames:
- 1 Week: -2.96%
- 1 Month: +7.53%
- 3 Months: +0.83%
- Year-to-Date (YTD): +18.87%
- 1 Year: 0.00%
- 3 Years: 0.00%
The stock has shown strong performance year-to-date, with an 18.87% increase, but it has remained flat over the past year.
Conclusion
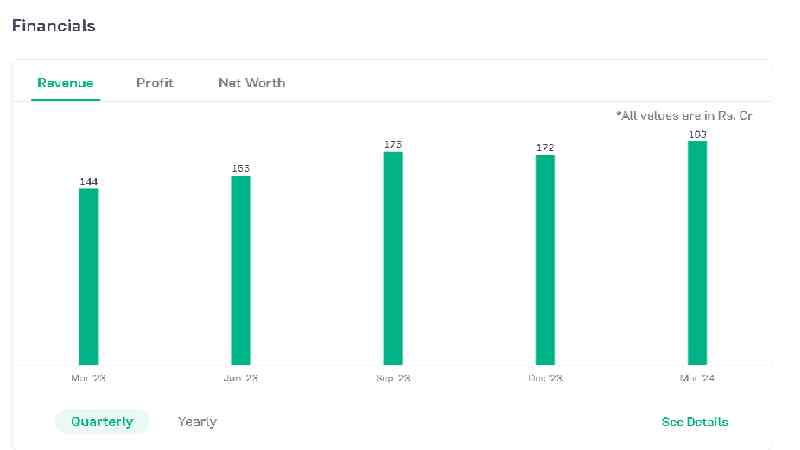
Yatharth Hospital and Trauma Care Services Ltd.’s stock presents a mixed picture for investors. While the year-to-date performance is robust, recent price action shows some weakness. The stock’s valuation metrics suggest it may be undervalued compared to the sector, but investors should consider the company’s fundamentals and growth prospects before making investment decisions.
Traders may find opportunities in the short-term price movements using the identified support and resistance levels. However, as with all investments, thorough research and risk management are essential.


